Google’s first AI & Economy ATLAS report finds evidence of Gemini use across 68% of detailed occupations. That sounds like a measure of how many people use AI at work. It is actually a measure of how many occupational categories appear in a particular dataset, after minimum usage thresholds are applied.
That distinction changes how the findings should be read. The study offers a large view of what people ask certain Google AI products to do. It cannot, by itself, establish how many workers use AI, how much faster they work or how many jobs it will replace.
Published on 23 July, the ATLAS report analyses 14,653,926 de-identified interactions from 6–19 April 2026. Its product coverage includes the Gemini app, Google AI Mode and eligible Gemini API activity. The observation window is a fortnight in April, even though the findings arrived in July.
Following a conversation into the statistics
The researchers first classify interactions as work-related or non-work-related. They summarise them, group similar observations and map those groups onto established categories. Work is mapped to occupational and task classifications; non-work activity is mapped to categories used in time-use statistics.
This makes a vast collection of conversations easier to analyse. It also introduces judgement at several stages. A request to draft a letter might be work, personal administration or something that cannot be confidently assigned from the available text. A classification system has to make that distinction before the interaction contributes to a published percentage.
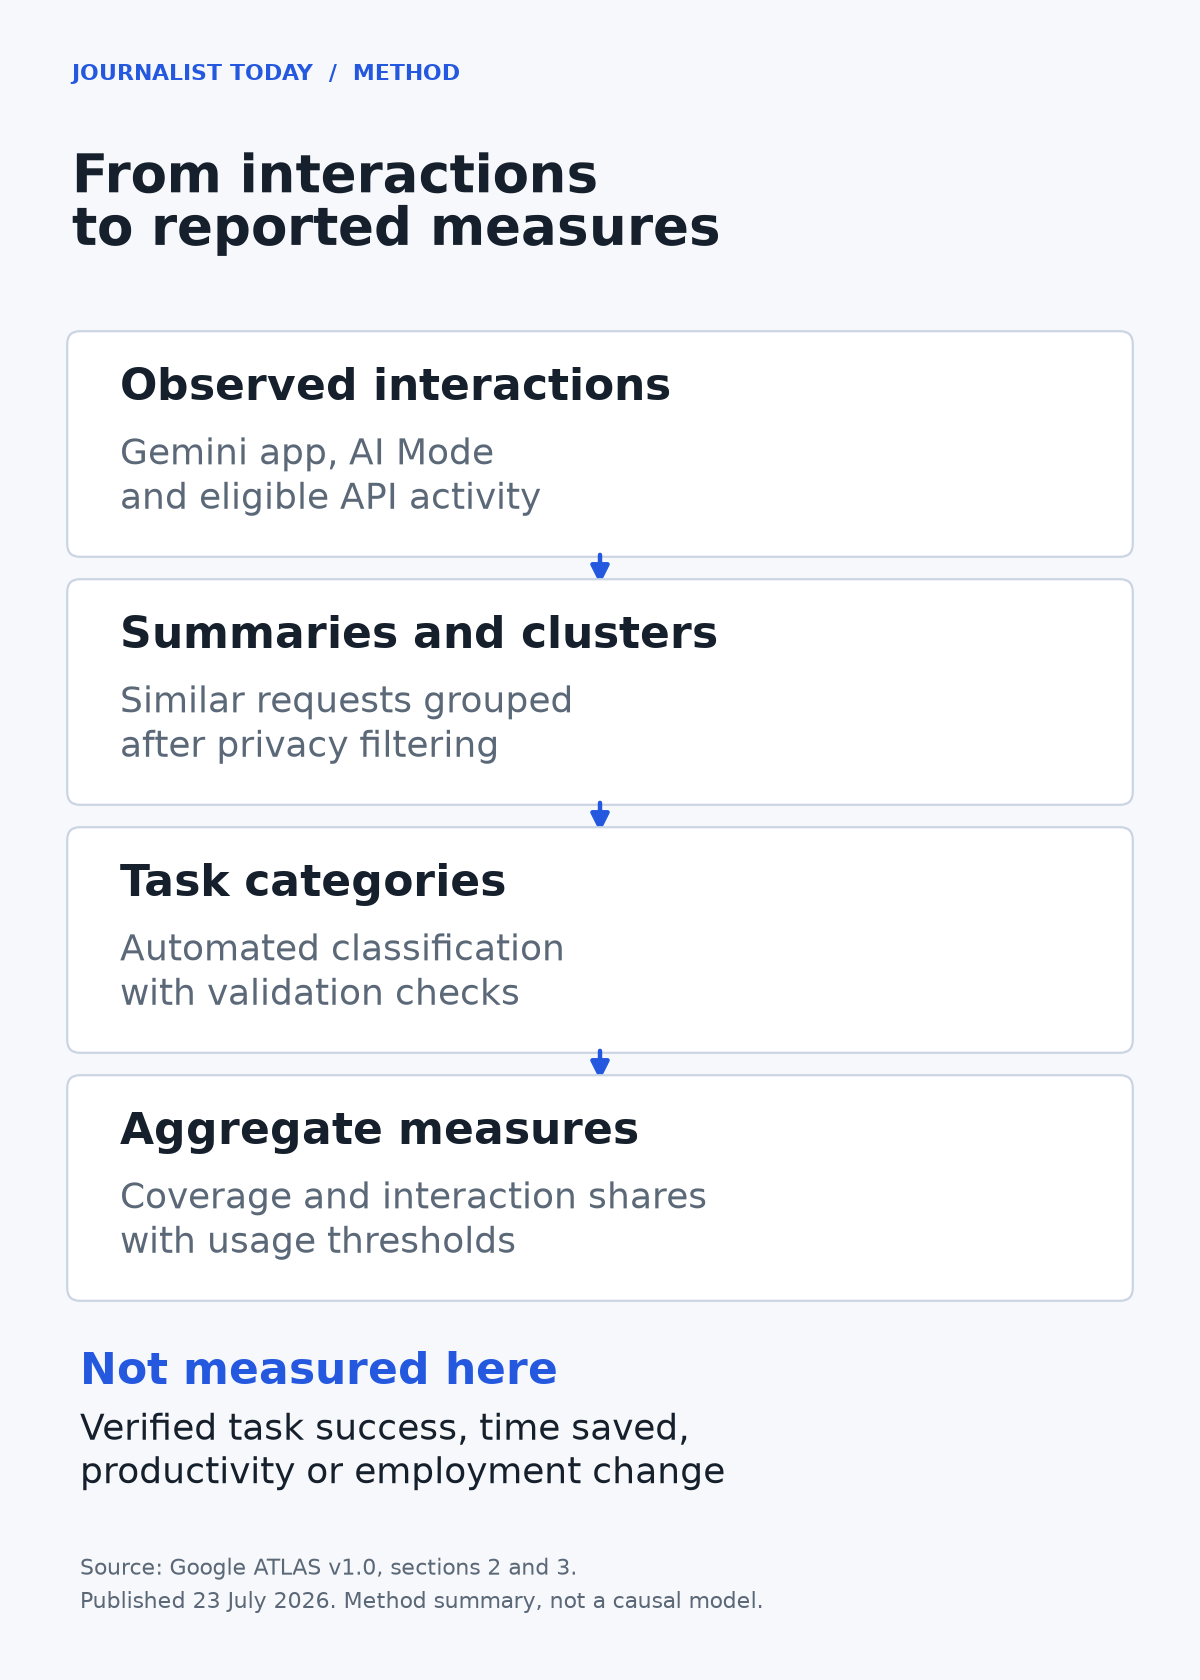
How ATLAS turns interactions into aggregate measures. The final step does not observe whether an output was used successfully or saved time.
Google describes several privacy protections: removing identifying information, replacing log identifiers, summarising the underlying content and excluding clusters with fewer than ten distinct users. Original conversation text and individual summaries are not retained in the final dataset, according to the methodology.
Those protections affect interpretation as well as privacy. Very small patterns can disappear from the analysis. An occupation with no recorded usage above a threshold may have users who are too few to be counted. It may also involve work poorly suited to the included products. A missing category does not establish that nobody in that occupation has tried AI.
The report evaluates its classification pipeline using several methods, including human assessment and a generated dataset with known category labels. Even with those checks, the authors acknowledge uncertainty in deriving precise tasks and job categories from conversation text. Broad patterns deserve more confidence than an exact ranking of narrowly defined occupations.
Three percentages with three different denominators
The study reports meaningful usage in 68% of detailed occupational categories, using a minimum of 50 users globally for the occupational coverage measure. The covered categories account for 88.4% of employed civilian workers in the US, when mapped to the employment statistics used by the researchers.
The second number describes the size of those occupations in the labour market. It does not say that 88.4% of American workers use Gemini. A large occupation can enter the covered group once its usage threshold is met, even if most people employed in it never appear in the sample.
Task coverage asks a narrower question. The researchers look for individual tasks with at least 25 users globally. Among occupations where at least one task meets that threshold, the median share of tasks with observed usage is 21%.
That conditional phrase matters. Occupations with no qualifying task are excluded from the median. The figure therefore does not mean that every occupation has one fifth of its work handled by AI. Nor does it mean that a typical employee delegates one fifth of the working day.
| Reported measure | What is counted | What it does not establish |
|---|---|---|
| 68% occupation coverage | Occupational categories with usage above the study threshold | The share of workers using AI |
| 88.4% employment coverage | US employment in those covered categories | The share of US employees who are users |
| 21% median task saturation | Qualifying tasks within occupations with some observed task use | The share of working hours automated |
A task list is not a timesheet. One listed task may occupy minutes each week, while another consumes most of a working day. Counting task categories gives useful breadth information, but converting that count directly into labour hours would require evidence the measure does not contain.
The employment comparison also uses US statistical categories to contextualise globally observed activity. It should not be relabelled as an Indian workforce adoption rate. Readers interested in India would need country-specific evidence about occupations, access, use and outcomes.
Where AI activity is concentrated
One of the clearer comparisons concerns the type of task rather than a prediction about job losses. Non-routine cognitive analytic tasks account for roughly 35% of the O*NET task categories in the report’s comparison, but about 65% of the observed work-related Gemini interactions.
These are tasks that require analysis rather than a fixed physical routine. Their prominence fits the kinds of requests conversational systems can accept: interpreting information, developing an argument, working through a document or helping solve a coding problem.
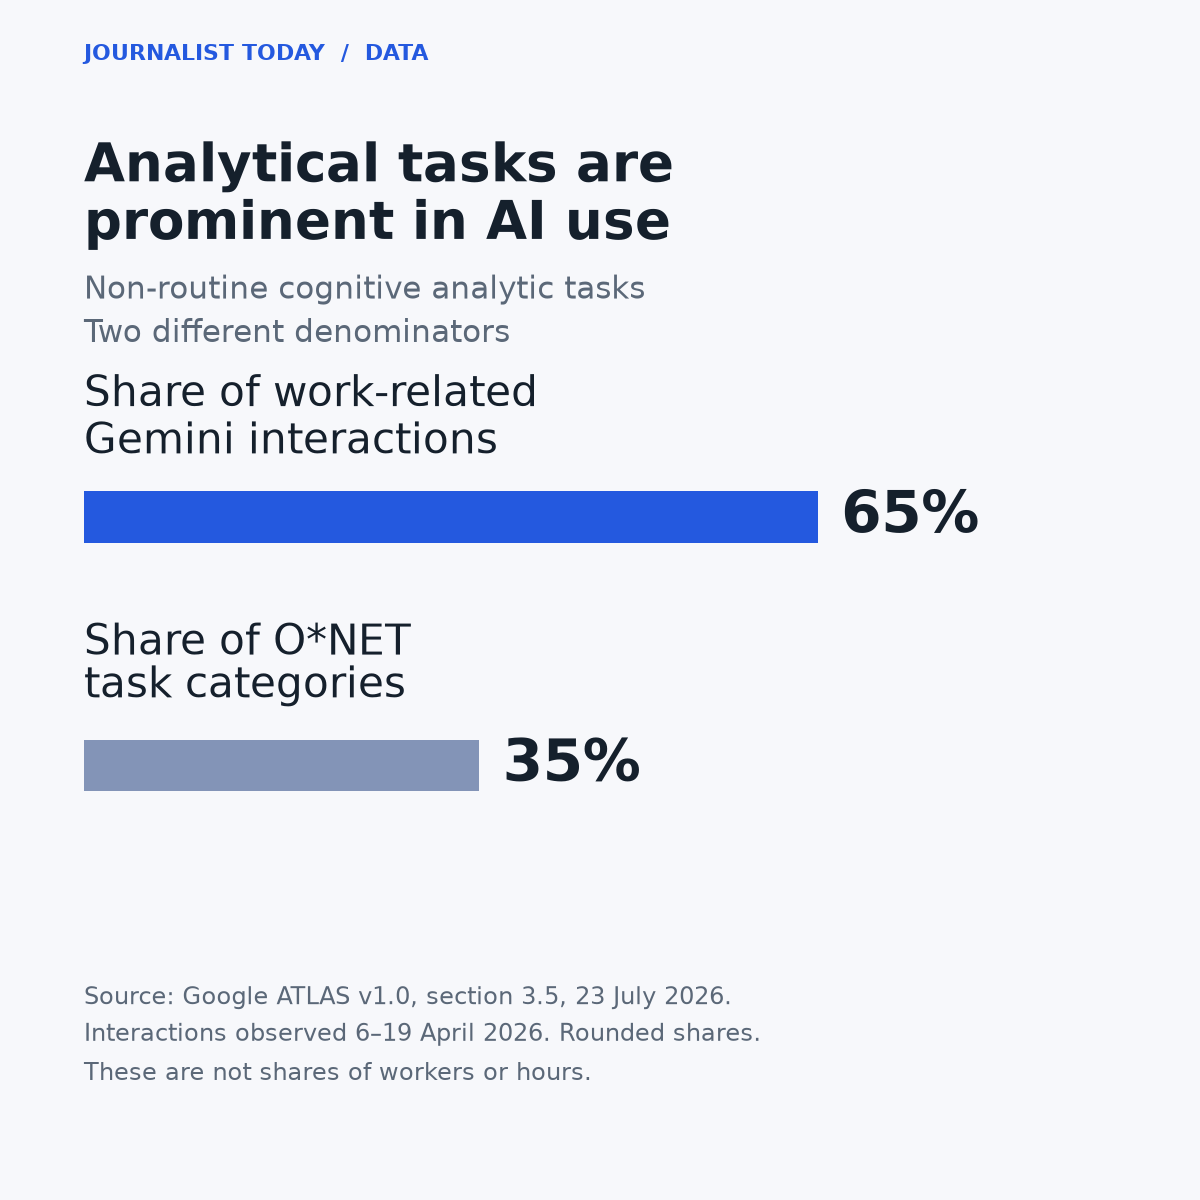
Rounded shares reported in ATLAS v1.0. The bars compare task categories with interaction volume; they do not measure employee adoption or hours saved.
The chart deliberately names both denominators. One bar counts types of tasks in a classification system. The other counts interactions in the sample. It shows that this kind of task is disproportionately represented in observed AI activity. It does not estimate that AI has completed 65% of analytical work.
Repeated attempts also complicate a simple volume interpretation. Several conversations about one difficult document may produce more recorded activity than one successful request about an easier document. Without connecting interactions to a verified result, more activity cannot automatically be treated as more value.
The report’s broader finding is consistent with AI being used for parts of many jobs, especially cognitive work. It leaves open how these tools change the surrounding workflow, including the time needed to check results and correct mistakes.
A large dataset still has boundaries
ATLAS v1.0 does not include the content of paid Gemini API usage in its detailed task classification. Google notes that paid API request counts contribute to geographic analysis, but that the content needed for more granular analysis is unavailable.
The report also excludes several other Google experiences, including Workspace, AI Overviews, Translate, Maps and Antigravity. These omissions matter because an organisation using AI inside office software or through a paid API may be doing substantial work outside the observed task dataset.
This is therefore neither a census of Google’s AI activity nor a census of all AI activity. Other providers’ products are outside its scope, and people who do not use the covered tools are absent.
The two-week observation window creates another boundary. Seasonal work can be more visible at certain times of year; the report itself notes that April sampling may affect the prominence of tax-related requests. A later sample could look different without either snapshot being wrong.
Model capabilities and product interfaces also change. The July publication date does not turn April interactions into evidence about tools released afterwards. Any comparison with a future ATLAS edition will need to check whether the products, sampling and classification methods remain sufficiently similar.
Use is easier to observe than usefulness
The report explicitly says that a completed conversation does not guarantee the user achieved a goal, saved time or created measurable economic value. That is a substantial limit, and it should travel with the headline findings.
Consider a hypothetical analyst using AI to draft a supplier comparison. The conversation could contain requests to summarise documents, construct a table and rewrite an explanation. All of those requests provide evidence of use.
Whether the task became faster depends on what happened around the conversation. Did the analyst verify each supplier’s specification? Were the figures current? Did a colleague have to repair unsupported conclusions? A completed draft and an accepted, accurate comparison are different outcomes.
The same distinction applies to automation. An interaction that asks a model to do a whole task does not prove that the resulting work was accepted without human intervention. A request can show intent to delegate; an outcome study needs to establish what was delivered and how it performed.
ATLAS is useful for identifying which tasks deserve closer examination. It can help researchers formulate questions about adoption and help organisations locate plausible areas for trials. It cannot supply a company’s return on investment simply by multiplying an interaction share by its payroll.
How a workplace could test the missing outcomes
A team evaluating an AI workflow can use the report’s categories as a starting point, then measure the specific result it needs. For a document-review task, that might be the number of important issues found, the number of false alarms and the time required to reach an accepted final version.
The comparison should include the full workflow. Setup, prompting, checking and rework all consume time. Counting only the first generated answer can make an apparently quick system look more useful than it is in practice.
A fair trial would also compare similar assignments. Giving the group using AI tools simple documents and the other group difficult ones would confound the result. Where possible, the same quality criteria should be applied without the reviewer being told how each output was prepared.
Those are proposed evaluation principles, not experiments reported by ATLAS. They address a different question: whether a particular use improves a particular workplace outcome. That question requires evidence beyond the existence of a conversation.
Permission and access are part of the workflow too. A task may be technically feasible but unsuitable for a tool that lacks the organisation’s required data controls. Our coverage of Zero Trust guidance for AI examines why the identity, data access and permitted actions need to be defined alongside the use case.
What to retain from the first report
ATLAS provides evidence that observed AI use reaches a wide range of occupational categories while remaining uneven across their constituent tasks. Its scale helps expose patterns that a handful of product demonstrations cannot show.
The strongest reading keeps the unit of measurement attached to every claim. Occupations are categories, employees are people, tasks are activities and interactions are records of use. Productivity requires a further link to outcomes.
For readers following workplace AI, that makes the first edition a useful baseline with clearly stated limits. A future report showing broader task coverage would be evidence of changing use under its methodology. Establishing that the change produced better work, higher output or altered employment would still require additional measurement.
Questions
When were the ATLAS interactions observed?
The first report analyses interactions from 6–19 April 2026 and was published on 23 July.
Does 68% occupation coverage mean 68% of workers use AI?
No. It counts occupational categories meeting a usage threshold, rather than the proportion of employees who use AI.
Does ATLAS measure productivity gains?
It measures interactions and classified use. Verified task success, time saved and productivity require additional evidence.