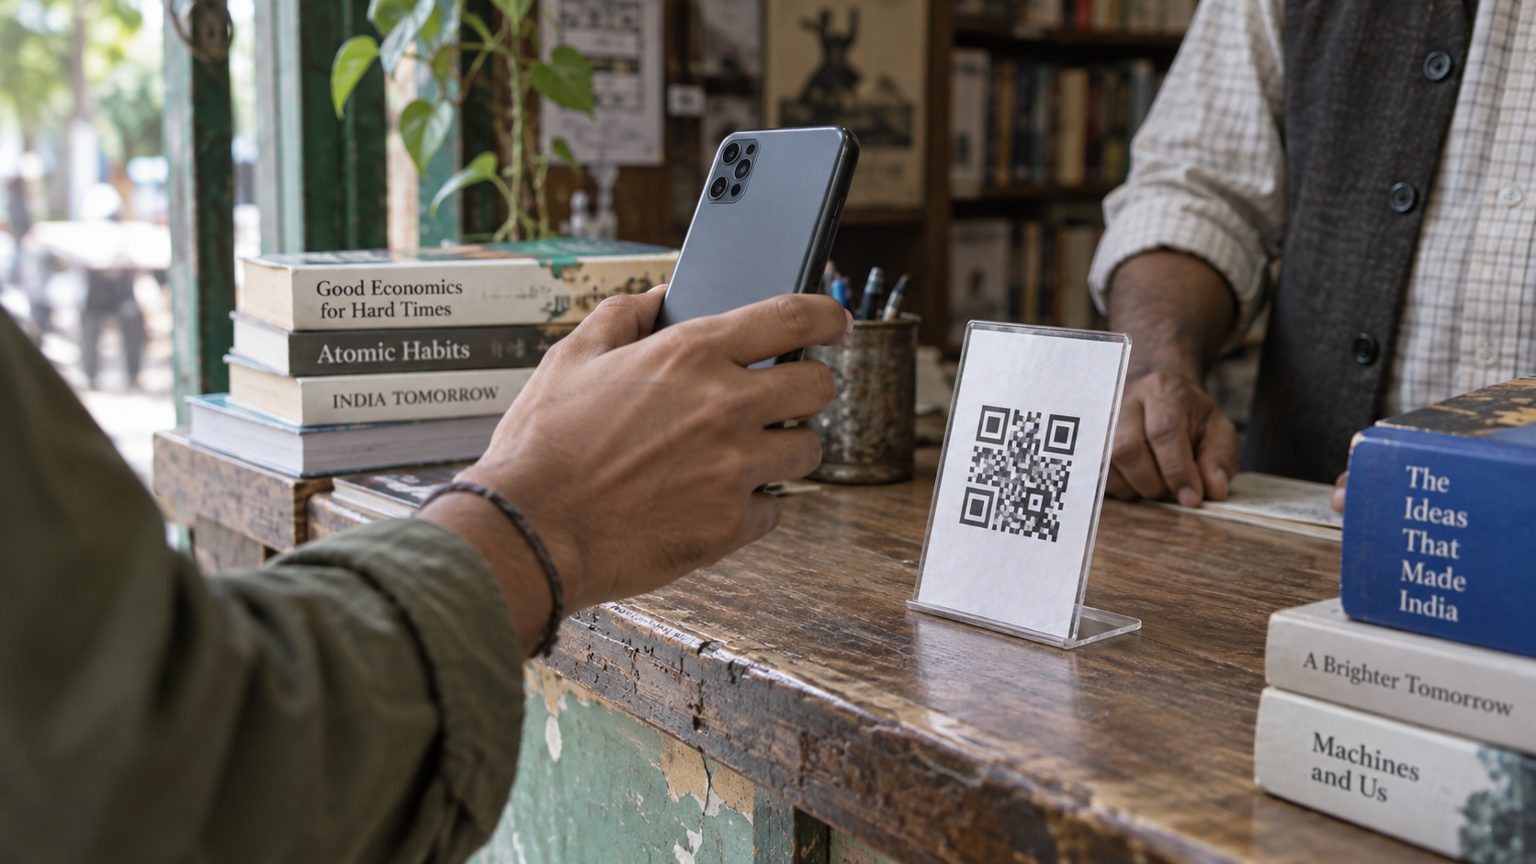
Scanning a UPI QR code gives your payment app a destination. The transfer still depends on an instruction being checked, authorised, routed between participating institutions and recorded in the right accounts. Understanding those steps helps explain both UPI’s convenience and the awkward moment when a shopkeeper says a payment has not arrived.
This article follows an ordinary bank-account payment to a merchant in India. UPI also supports other instruments and features, whose authorisation and funding arrangements can differ. We then examine NPCI’s April–August 2026 figures to see what rising transaction counts actually tell us about how the network is being used.
A QR code supplies payment details
A static QR code can sit on a counter and be scanned by many customers. A dynamic code is generated for a particular transaction and can carry its amount and reference. Both reduce the need to type a payment address, but the person paying still needs to check what the app displays. The printed card and the payment destination should correspond to the merchant they intend to pay.
The important moment is the confirmation screen: the recipient, amount and selected funding account need to be right before approval. A successfully scanned image only means that the app could interpret its contents. It does not establish that the sticker belongs to the shop or that a requested amount matches the bill. A QR code copied onto another piece of paper remains machine-readable.
NPCI’s UPI overview describes static and dynamic merchant codes and the interoperability that allows a customer using one participating app to pay a recipient using another. That shared scheme is why the logo on the customer’s phone need not match the logo on the counter. The common payment rules connect services that would otherwise have to build separate arrangements with each other.
The app and the bank have different jobs
For a bank-account payment, the app presents the transaction and helps the customer approve it. A payment service provider, or PSP, connects the application to the UPI ecosystem. The bank holding the payer’s account handles the account-level authorisation and debit. The beneficiary bank handles the receiving side. One institution may perform more than one role, so a simple list of brands is a poor guide to the underlying responsibilities.
NPCI operates the scheme and processes payment instructions between participants. Its consolidated UPI circular, issued on 18 September 2026, sets out participant roles, authentication responsibilities and transaction requirements. For this explanation, the useful distinction is between presenting a request, authorising access to an account and completing the transfer between accounts.
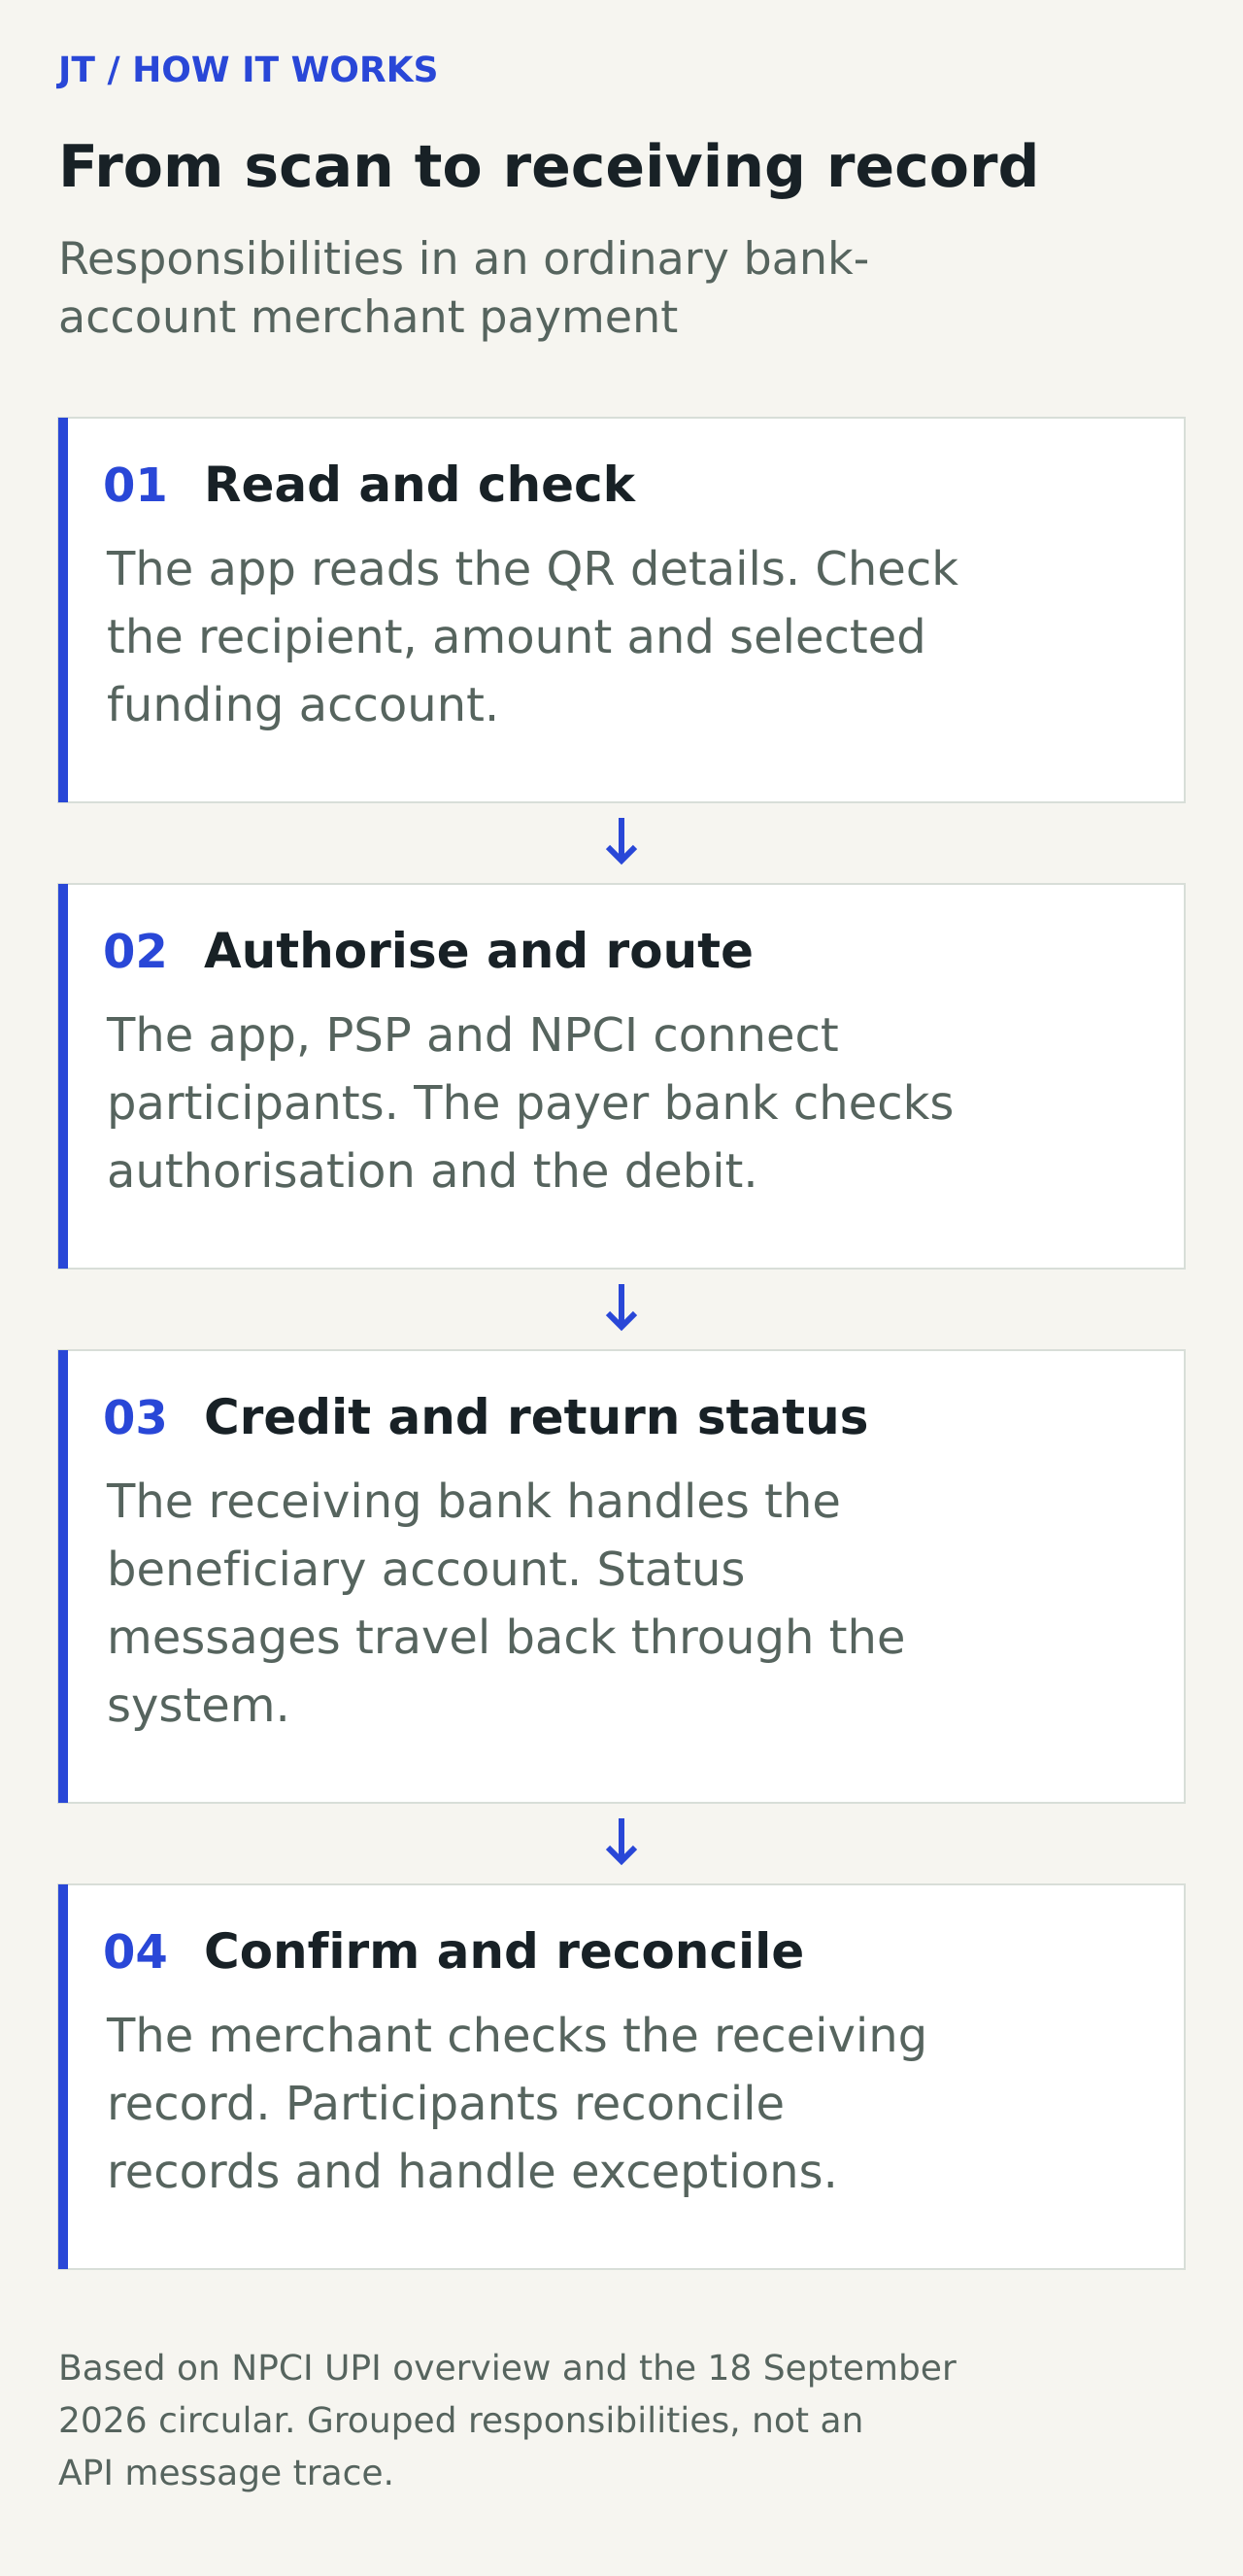
Functional view of an ordinary bank-account merchant payment, based on NPCI’s UPI overview and consolidated circular. This diagram groups responsibilities; it is not a message-by-message API trace. Status messages travel back through the participants.
Approving a payment is an instruction to move money. The authentication method protects that instruction: commonly a UPI PIN, with supported alternatives subject to the applicable feature and participant implementation. Protecting a phone’s screen lock and protecting the payment credential are related tasks, but they are not automatically the same control. The passkey explainer examines that distinction in account access more broadly.
The separation of responsibilities also explains why switching apps is not a universal fix for a failed payment. Two apps can depend on the same bank or another shared participant. Conversely, an issue in one app’s connection need not mean the entire UPI network is unavailable. A useful incident report identifies the affected component and period instead of treating every failure as a national outage.
A result on a screen is one part of the record
There are several observations a customer or merchant can make: the app has accepted an instruction, the payer sees a debit, the transaction has a successful status, and the recipient can identify a corresponding credit. During normal operation these observations arrive close enough together to feel like one event. A delay or mismatch makes their separation visible.
At a busy counter, showing the customer’s phone may be convenient, but a merchant needs confirmation tied to their own receiving account or payment service. A screenshot is a copy of a display, and a sound notification is an interface signal. Matching the transaction reference, amount and receiving record provides more useful evidence than comparing two people’s recollections of what appeared on a screen.
For online sellers, the same distinction exists between the payment system and the order system. A payment can require reconciliation with an order reference before goods are released. Conversely, an abandoned checkout page does not on its own prove that no payment instruction was processed. These are reasons to keep transaction and order records connected, rather than relying on the customer-facing page as the sole record.
NPCI treats settlement and reconciliation as distinct parts of its operating framework. The infrastructure work between participants should not be confused with an individual customer’s balance display. Describing UPI as a real-time payment system does not remove the need for participants to reconcile records or handle exceptions. It means a reader should ask which event a claim about speed is actually measuring.
Daily averages tell a clearer growth story
NPCI reported 22,346.80 million UPI transactions in April 2026 and 24,508.96 million in August. The raw monthly count therefore increased by about 9.7%. April had 30 days, while August had 31. Dividing each month’s volume by its number of calendar days reduces the effect of that difference: the daily average rose from approximately 744.9 million to 790.6 million, or 6.1%.
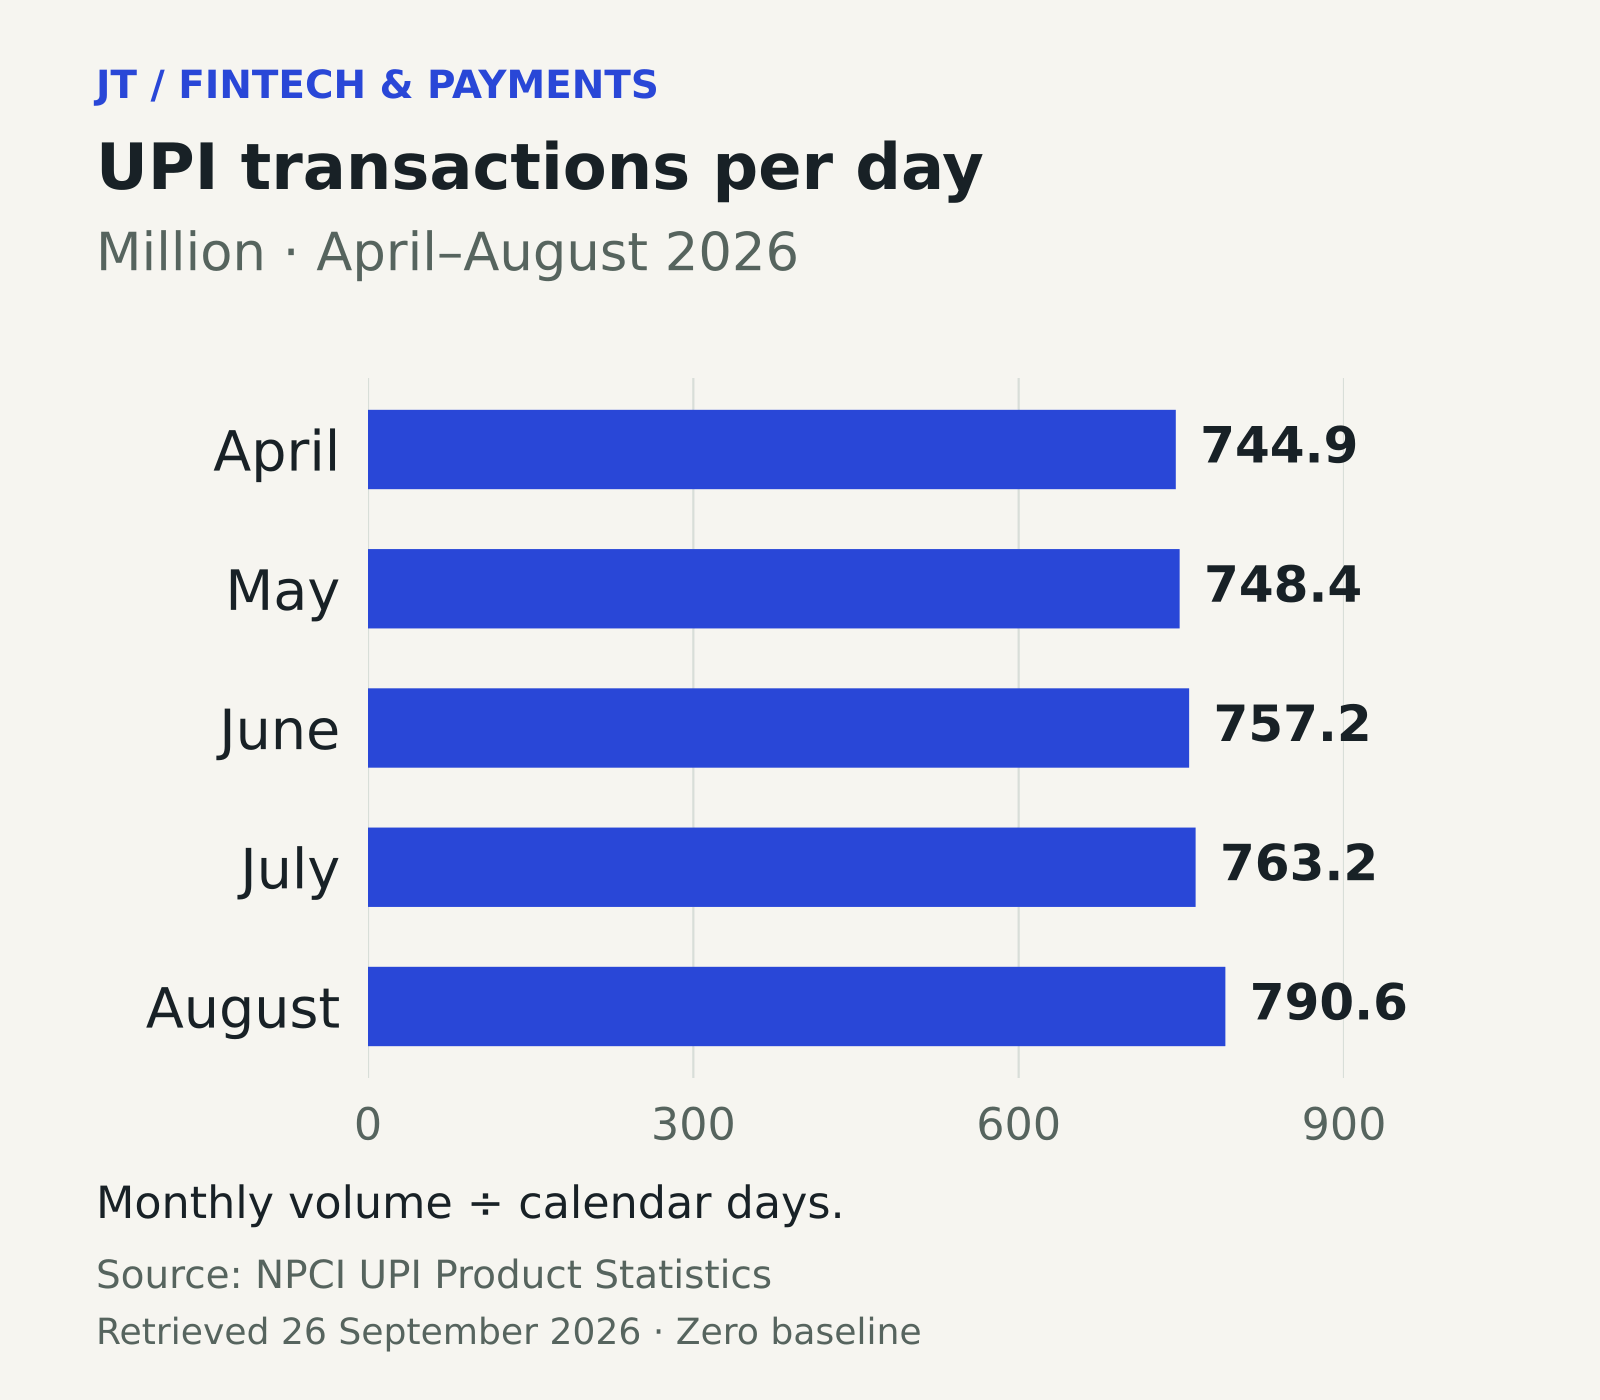
Source: NPCI UPI Product Statistics, April–August 2026, retrieved 26 September 2026. Calculated daily average = reported monthly transaction volume divided by calendar days. The chart uses a zero baseline.
The month-length adjustment changes the interpretation of June as well. Its total transaction count was below May’s, but its average per day was higher. Reporting only the monthly totals would suggest a setback that does not appear in the daily average. Neither view describes individual days; both summarise a month, and a monthly average can conceal peaks, outages or unusual trading periods.
A higher count is evidence of more transactions passing through the measured system. It does not tell us how many additional people joined, how many merchants accepted UPI for the first time, or whether existing customers simply paid more often. Those are different questions requiring user, merchant or transaction-mix data. One person buying lunch several times generates several payments, not several new users.
The same caution applies to claims about cash replacement. A rise in UPI activity can be consistent with more everyday purchases moving to digital payments, but the aggregate count alone cannot measure how much cash would otherwise have been used. The counterfactual is missing. A careful analysis states what the series measures before attaching a wider economic explanation to it.
More payments can come with a smaller average amount
NPCI publishes transaction value alongside volume. Dividing the two gives a calculated mean transaction amount. For the same five months, that mean fell from about ₹1,299 in April to ₹1,217 in August, a decrease of approximately 6.3%. Daily transaction activity rose over the period while the average amount per transaction declined.
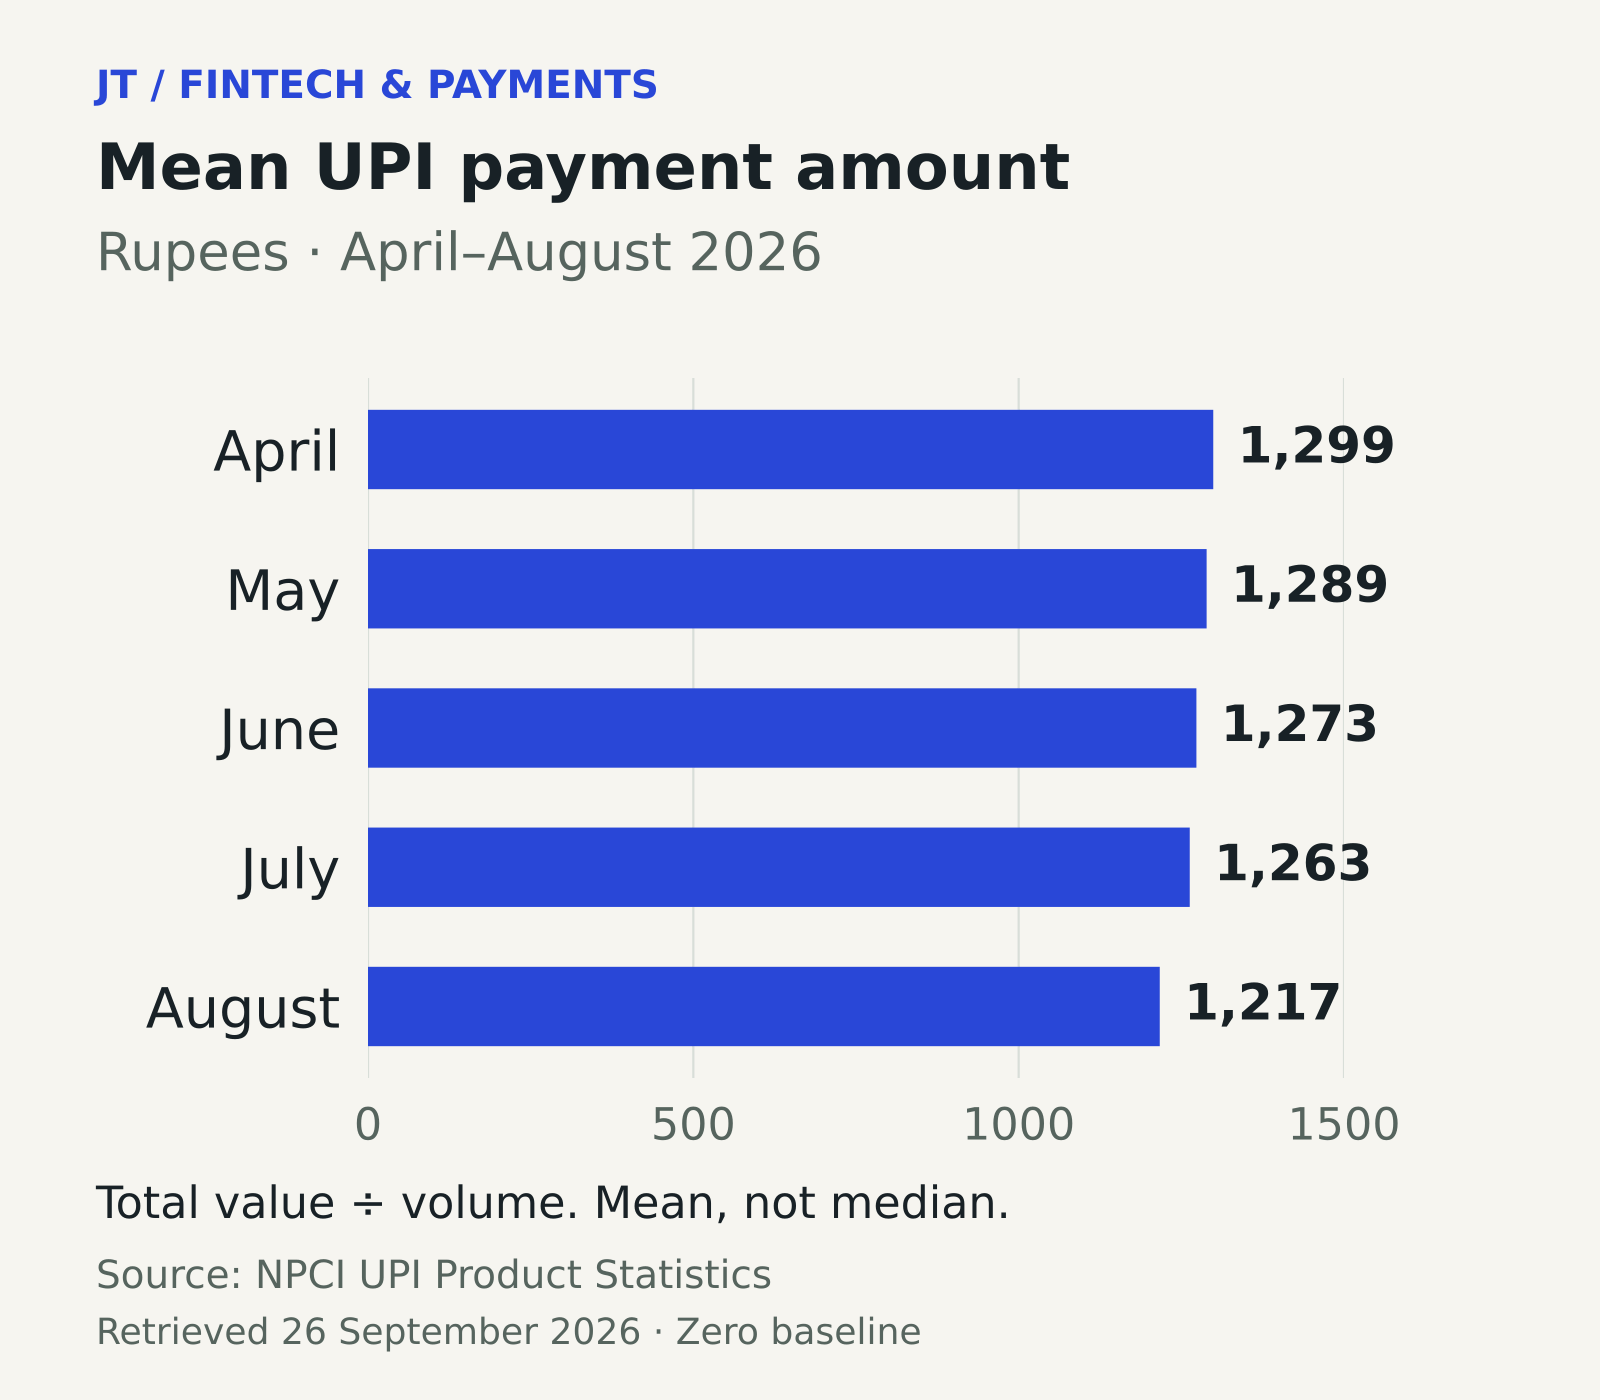
Source: NPCI UPI Product Statistics. Mean amount in rupees = value reported in crore × 10 ÷ volume reported in million. Values are rounded for display. A mean is not a median or a typical shop bill.
One possible explanation is a changing mix towards smaller payments. That is an interpretation to investigate, rather than a conclusion established by these totals. A smaller mean can also reflect fewer large transfers or changes in several transaction types at once. Person-to-person transfers and merchant purchases are not interchangeable measures of consumption, and the all-UPI series combines activity across use cases.
For a payment business, the practical implication is that capacity planning cannot be based on rupee value alone. A system serving more individual instructions may have more status checks, confirmations and support interactions even if the total value grows slowly. The figures here do not measure those workloads directly, but they show why transaction count and transaction value answer different operational questions.
For a merchant, the relevant evidence remains local: the shop’s own payment mix, repeat customers, failed attempts and time spent reconciling orders. National growth establishes scale and direction at the network level. It does not supply a forecast of sales for a particular business, nor does a lower national mean show that an individual merchant’s customers are spending less.
The figures behind the charts
| Month in 2026 | Transactions, million | Value, ₹ crore | Daily average, million | Mean amount, ₹ |
|---|---|---|---|---|
| April | 22,346.80 | 29,02,988.05 | 744.9 | 1,299 |
| May | 23,201.93 | 29,90,424.21 | 748.4 | 1,289 |
| June | 22,716.07 | 28,92,138.67 | 757.2 | 1,273 |
| July | 23,658.35 | 29,87,880.49 | 763.2 | 1,263 |
| August | 24,508.96 | 29,82,355.95 | 790.6 | 1,217 |
The first two numerical columns reproduce NPCI’s reported series; the last two are calculations from those values. One crore is ten million, which explains the conversion factor in the mean-amount formula. Calculations use unrounded source numbers before the displayed results are rounded. The source notes that transactions debiting and crediting the same account have been excluded since August 2018.
This is a five-month descriptive comparison. It is not a forecast, a measure of unique users or a causal test of why people changed their payment behaviour. The table is included so a reader can reproduce the calculations without estimating values from the height of a bar. Future revisions to the source series could change a subsequently calculated result.
When a payment is uncertain, keep the reference
A customer faced with an uncertain result needs the transaction reference, amount, time and the status shown by the app. A merchant needs the corresponding receiving-side record. Keeping those details together makes it easier to explain the problem to the payment service or bank. Repeatedly creating new payments before resolving the first one’s status can leave several instructions to untangle.
Use the support route inside the relevant app or the bank’s official channel, and explain whether the issue is an apparent debit without receipt, an incorrect recipient, a failed payment or an order that has not been matched. Those descriptions refer to different problems. The official UPI Help service is another NPCI route for transaction-related assistance; follow the instructions applicable to the particular case.
Do not give a payment PIN to someone offering to investigate a transfer. NPCI’s customer guidance says the app does not store or read that PIN and bank support will not ask for it. A genuine support conversation should be about identifying the transaction and following the official process. The fact that someone knows the amount or merchant name is not proof that they represent the bank.
UPI’s familiar scan-and-pay experience rests on cooperation between several systems. A useful way to judge that experience is to follow the instruction all the way to a verifiable receiving record, then examine network statistics with the same care about definitions. The question at a counter is whether this payment arrived. The question in a chart is exactly which activity was counted.
Questions
Does scanning a UPI QR code immediately transfer money?
Scanning supplies payment details to the app. An ordinary bank-account payment still requires the transaction to be approved and processed by the participating systems.
Why can UPI monthly volume fall while daily use rises?
A shorter month can have fewer transactions in total despite a higher daily average. Compare both the reported total and the number of days in the period.
Is the average UPI transaction amount a typical purchase size?
No. It is the total reported value divided by the number of transactions, across the source’s included use cases. It is not the median merchant purchase.
Where can I report a problem with a payment?
Start with the transaction’s support option in the relevant payment app or your bank’s official channel. Keep the transaction reference and receiving-side details where available.
Sources
- NPCI: UPI overview and customer FAQs.
- NPCI: UPI Product Statistics, April–August 2026 series, retrieved 26 September 2026.
- NPCI: UPI Consolidated Circular, version 1.0, 18 September 2026.
- NPCI: UPI Help.
Explore our Fintech & Payments coverage, or send a correction.