
UPI handled about 24,162 crore transactions worth roughly ₹314 lakh crore in the financial year 2025–26, according to the Ministry of Finance’s 30 April account of the system’s first decade. Transaction volume grew 30% year on year, while total value increased 20.59%.
Those two growth rates describe different things. The number of payments rose faster than the rupee amount moving through them, so the average value per transaction fell. A larger payment network can process more money overall while becoming more heavily used for smaller payments.
Keep the period and the unit together
The fiscal-year total covers April 2025 through March 2026. It should not be compared directly with a calendar-year total unless the period difference is made explicit. The Ministry’s release discusses both financial years and calendar years in different sections, making that distinction particularly important.
A crore is ten million. The reported 24,161.69 crore transactions therefore correspond to about 241.62 billion transactions. A lakh crore rupees is one trillion rupees, so the approximately ₹314 lakh crore total is about ₹314 trillion.
These conversions change the notation, not the underlying activity. Counting in billions can help an international reader, while crore and lakh crore are the familiar units in Indian payment reporting. Keeping the original units beside the converted values makes it easier to check the arithmetic against the source.
| Measure | FY2025–26 figure | What it records |
|---|---|---|
| Transaction volume | 24,161.69 crore | Number of transactions |
| Transaction value | Approximately ₹314 lakh crore | Total rupee amount transferred |
| Volume growth | 30.0% year on year | Change in transaction count |
| Value growth | 20.59% year on year | Change in total transferred value |
The table uses the Ministry’s published figures. The value total is rounded, so calculations using it are approximate.
The growth gap changes the average
An average ticket size is total transaction value divided by total transaction count. Using the rounded annual figures gives an average of about ₹1,300 per UPI transaction.
That average does not describe the most common payment. A relatively small number of large transfers can pull a mean above the values people usually pay at a shop. It also combines different uses of UPI, including transfers between people and payments to merchants.
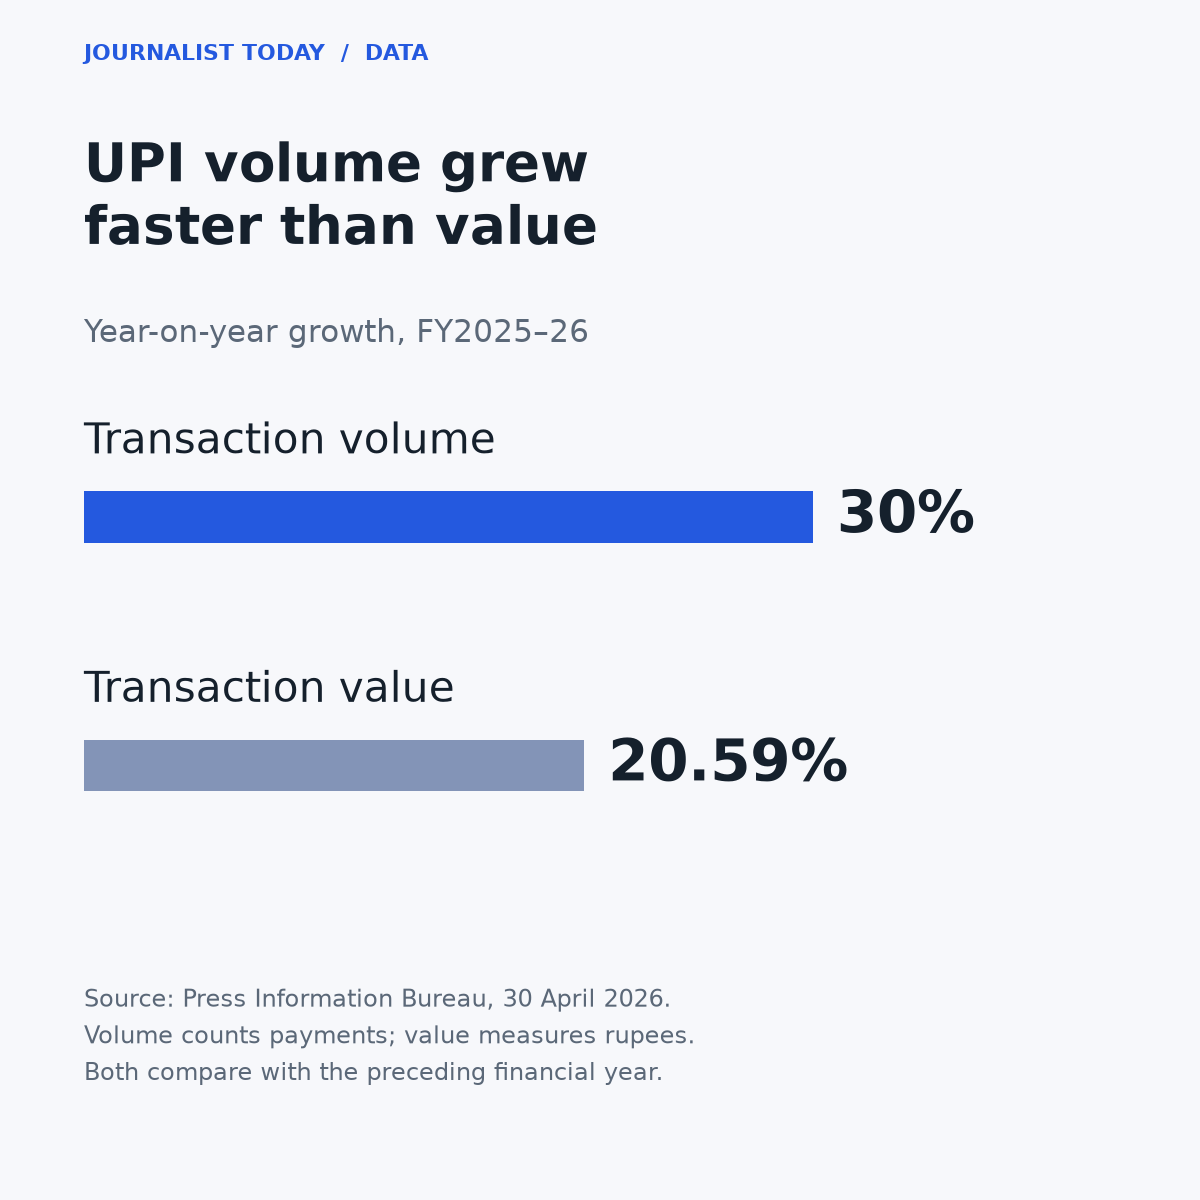
Source: Ministry of Finance, 30 April 2026. Growth rates compare FY2025–26 with the preceding financial year. Volume measures transactions; value measures rupees transferred.
The change in average ticket can be calculated without reconstructing the previous year’s rounded totals. Divide the value growth factor, 1.2059, by the volume growth factor, 1.30. The result is about 0.928, implying an average ticket roughly 7.2% lower than a year earlier.
This is a calculation from aggregate growth rates, rather than a measurement of how one person’s spending changed. It cannot establish whether existing users made smaller payments, new users entered with different habits, or the mix of payment types shifted. Several changes can produce the same aggregate result.
Scale does not measure the number of users
A transaction count includes repeated activity. One person paying several times a day contributes several transactions, so annual volume cannot be converted into a count of distinct users or merchants without additional data.
The same caution applies to banks. The release reports 703 banks live on UPI as of March 2026. That is a measure of institutional participation. It does not mean that each bank contributes the same share of transactions or delivers the same performance in every circumstance.
For a merchant, network scale is useful context, but it does not replace the information needed to manage a particular payment: the receiving account, the transaction reference and the status recorded by the service. Aggregate growth cannot resolve an individual pending payment.
Avoid mixing the source’s different snapshots
The Ministry’s release contains several time windows, including a person-to-person versus person-to-merchant chart labelled for the first half of 2025. That chart should retain its own period when cited. It should not be silently relabelled as the complete FY2025–26 mix.
The difference matters because composition changes over time. A merchant share measured during one six-month period does not establish the share for a later full financial year. A comparison that combines those figures could appear precise while answering no consistent statistical question.
The release also uses rounded headline figures beside more precise tabular values. Where the article calculates an annual average, the rounded value total limits the precision that can reasonably be claimed. Reporting an average to several decimal places would imply more certainty than the inputs provide.
What the annual figures can tell a business
Taken together, the reported growth rates show more frequent payment activity and a lower aggregate amount per transaction. A business planning payment operations can use that as context for the importance of handling many small transactions efficiently.
It still needs its own evidence for decisions about staffing, reconciliation or support. A shop’s transaction mix may differ substantially from the national average, and a service handling transfers between people may face a different pattern again.
The useful next comparison is between like periods and like payment types, with consistent units. Retaining those boundaries lets the annual figures answer a clear question about network activity, without turning them into unsupported claims about individual spending or commercial returns.
Follow further developments in Fintech & Payments.
Questions
What period does FY2025–26 cover?
It covers April 2025 through March 2026.
What was the approximate average UPI payment?
Dividing the rounded annual value by the reported transaction count gives about ₹1,300.
Why did the average fall while total value rose?
Transaction volume grew faster than total value: 30% versus 20.59%, implying an average ticket roughly 7.2% lower.